
Long-term bonds generally provide higher yields than short-term bonds, because investors demand higher returns to compensate for the risk of lending money over a longer period. Occasionally, however, this relationship flips, and investors are willing to accept lower yields in return for the relative safety of longer-term bonds. This is called a yield curve inversion, because a graph showing bond yields in relation to maturity is essentially turned upside down (see chart).

A yield curve could apply to any type of bonds that carry similar risk, but the most studied curve is for U.S. Treasury securities, and the most common focal point is the relationship between the two-year and 10-year Treasury notes. The two-year yield has been higher than the 10-year yield since early July 2022, and in November and December the difference reached levels not seen since 1981. The biggest separation in 2022 came on December 7, when the two-year was 4.26% and the 10-year was 3.42% for a difference of 0.84%. Other short-term Treasuries have also offered higher yields; the highest yields in late December were for the six-month and one-year Treasury bills.1 (Although Treasuries are often referred to as bonds, maturities up to one year are bills, while maturities of two to 10 years are notes. Only 20- and 30-year Treasuries are officially called bonds.)
Predicting Recessions
An inversion of the two-year and 10-year Treasury notes has preceded each recession over the past 50 years, reliably predicting a recession within the next one to two years.2 A 2018 Federal Reserve study suggested that an inversion of the three-month and 10-year Treasuries may be an even more reliable indicator, predicting a recession within about 12 months.3 The three-month and 10-year Treasuries have been inverted since late October, and in December the difference was often greater than the inversion of the two- and 10-year notes.4
Weakness or Inflation Control?
Yield curve inversions do not cause a recession; rather they indicate a shift in investor sentiment that may reflect underlying economic weakness. A normal yield curve suggests that investors believe the economy will continue to grow, and that interest rates are likely to rise with the growth. In this scenario, an investor typically would want a premium to tie up capital in long-term bonds and potentially miss out on other opportunities in the future.
Conversely, an inversion suggests that investors see economic challenges that are likely to push interest rates down and typically would rather invest in longer-term bonds at today’s yields. This increases demand for long-term bonds, driving prices up and yields down. (Bond prices and yields move in opposite directions; the more you pay for a bond that pays a given coupon interest rate, the lower the yield will be.)
The current situation is not so simple. The Federal Reserve has rapidly raised the benchmark federal funds rate to combat inflation, increasing it from near 0% in March 2022 to 4.25%–4.50% in December. As the rate for overnight loans within the federal reserve system, the funds rate directly affects other short-term rates, which is why the yields on short-term Treasuries has increased so rapidly. The fact that 10-year Treasuries have lagged the increase in the funds rate may indeed mean that investors believe a recession is coming. But it could also reflect confidence that the Fed is winning the battle against inflation and will lower rates over the next few years. This is in line with the Fed’s projections, which see the funds rate peaking at 5.0%–5.25% by the end of 2023, and then dropping to 4.0%–4.25% in 2024 and 3.0%–3.25% in 2025.5
Inflation slowed somewhat in October and November, but there is a long way to go to reach the Fed’s target of 2% inflation for a healthy economy.6 The fundamental question remains the same as it has been since the Fed launched its aggressive rate increases: Will it require a recession to control inflation or can it be controlled without shifting the economy into reverse?
Upside Down
At the beginning of 2022, Treasuries presented a typical yield curve, with yields increasing for longer maturities. By the end of the year, yields in general were much higher, but the highest yields came from shorter-term securities.
Yield on Treasury Securities by Maturity
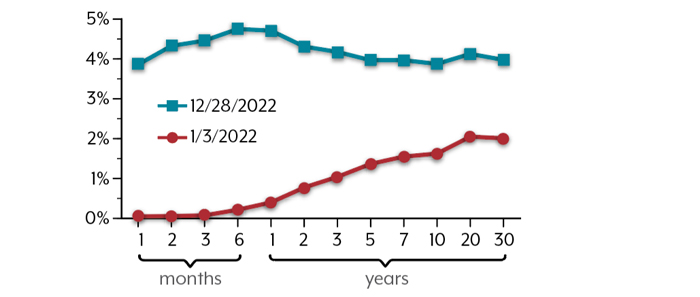
Months and Years to Maturity
Source: U.S. Treasury, 2022
Other Indicators and Forecasts
The yield curve is one of many indicators that economists consider when making economic projections. Among the most closely watched are the 10 leading economic indicators published by the Conference Board, with data on employment, interest rates, manufacturing, stock prices, housing, and consumer sentiment. The Leading Economic Index, which includes all 10 indicators, fell for nine consecutive months through November 2022, and Conference Board economists predict a recession beginning around the end of 2022 and lasting until mid-2023.7 Recessions are not officially declared by the National Bureau of Economic Research until they are underway, and the Conference Board view would suggest the United States may already be in a recession.
In The Wall Street Journal’s October 2022 Economic Forecasting Survey, a majority of economists believed the United States would enter a recession within the next 12 months, with an average expectation of a relatively mild 8-month downturn.8 More recent surveys of economists for the Securities Industry and Financial Markets Association and Wolters Kluwer Blue Chip Economic Indicators also found a consensus for a mild recession in 2023.9–10
For now, the economy appears fairly strong despite high inflation, with a low November unemployment rate of 3.7% and an estimated 3.7% Q4 growth rate for real gross domestic product.11–12 Unfortunately, the indicators and surveys discussed above suggest an economic downturn in the next year or so. This would likely cause some job losses and other temporary financial hardship, but a brief recession may be the necessary price to tame inflation and put the U.S. economy on a more stable track for future growth.
U.S. Treasury securities are guaranteed by the federal government as to the timely payment of principal and interest. The principal value of Treasury securities fluctuates with market conditions. If not held to maturity, they could be worth more or less than the original amount paid. Forecasts are based on current conditions, are subject to change, and may not come to pass.
1, 4) U.S. Treasury, 2022
2) Financial Times, December 7, 2022
3) Federal Reserve Bank of San Francisco, August 27, 2018
5) Federal Reserve, 2022
6, 11) U.S. Bureau of Labor Statistics, 2022
7) The Conference Board, December 22, 2022
8) The Wall Street Journal, October 16, 2022
9) SIFMA, December 2022
10) USA Today, December 15, 2022
12) Federal Reserve Bank of Atlanta, December 23, 2022
This information is not intended as tax, legal, investment, or retirement advice or recommendations, and it may not be relied on for the purpose of avoiding any federal tax penalties. You are encouraged to seek guidance from an independent tax or legal professional. The content is derived from sources believed to be accurate. Neither the information presented nor any opinion expressed constitutes a solicitation for the purchase or sale of any security. This material was written and prepared by Broadridge Advisor Solutions. © 2023 Broadridge Financial Solutions, Inc.